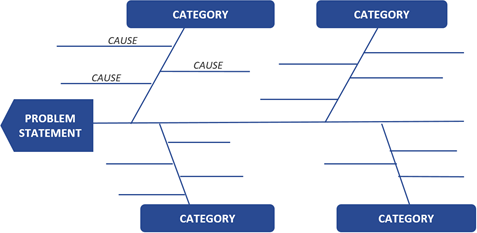
How to Use a Fishbone Diagram

Have you or your team ever had a problem you could not get to the bottom of? Identifying root causes can seem like a daunting task, particularly in a team setting. However, research shows that people generate 37% more ideas when they work as a team, compared to when they work alone. Working within a structure can make root cause analysis run much more smoothly. A cause and effect diagram, sometimes referred to as Ishikawa Diagram after its creator, Kaoru Ishikawa, is a structured team process that assists in identifying underlying factors or causes of variation within a specific event. Simply, it is brainstorming in a structured format. Together, your team can utilize this simple diagram to tackle your toughest problems.